Discrete Data
Discrete data, as the name suggests, consists of whole numbers or counts that can’t be further divided. This type of data is often used to represent things such as the number of cars sold in a month, the number of students in a class, or the number of eggs in a carton. Discrete data is typically represented using bar graphs, pie charts, or frequency tables.
For example, imagine that you’re conducting a survey of students and asking them how many siblings they have. The responses to this question would be discrete data since they involve whole numbers that can’t be divided (i.e., you can’t have half a sibling). You could use this data to create a pie chart that shows the percentage of students who have no siblings, one sibling, two siblings, etc.
Continuous Data
Continuous data refers to measurements or observations that can take on any value within a certain range. This type of data is typically represented using histograms, line graphs, or scatter plots. Examples of continuous data include height, weight, temperature, and time.
For instance, if you were measuring the temperature outside your house every hour, the resulting data would be continuous since it could take on any value within a certain range. You could use this data to create a line graph that shows how the temperature changes over time.
Nominal Data
Nominal data, also known as categorical data, deals with data that can be sorted into various categories but cannot be ranked or ordered. Examples of nominal data include gender, race, and religion. Nominal data is typically represented using bar graphs, pie charts, or frequency tables.

For instance, if you were conducting a survey of restaurant patrons and asking them which type of cuisine was their favorite, the resulting data would be nominal since it involves categories that cannot be ranked or ordered. You could use this data to create a pie chart that shows the percentage of people who preferred Italian, Chinese, Mexican, etc.
Ordinal Data
Ordinal data is similar to nominal data in that it involves categories, but in this case, the categories can be ranked or ordered. Examples of ordinal data include socioeconomic status, education level, and survey responses that ask people to rate a product or service on a scale from 1 to 5. Ordinal data is typically represented using bar graphs or histograms.

For example, if you were conducting a survey of customer satisfaction with a product or service, and asking respondents to rate their satisfaction level on a scale from 1 (very dissatisfied) to 5 (very satisfied), the resulting data would be ordinal since it involves categories that can be ranked or ordered. You could use this data to create a bar graph that shows the number of people who rated the product or service as 1, 2, 3, 4, or 5.
In conclusion, understanding the different types of data is essential for collecting, analyzing, and interpreting data accurately. By using the appropriate methods for each type of data, you’ll be able to make informed decisions and draw meaningful conclusions from your research.If you are looking for Discrete vs Continuous Data – What’s the Difference? you've came to the right place. We have 6 Pictures about Discrete vs Continuous Data – What’s the Difference? like Discrete vs Continuous Data – What’s the Difference?, deleddesign: Discrete Data Definition and also deleddesign: Discrete Data Definition. Here it is:
Discrete Vs Continuous Data – What’s The Difference?
 www.g2.com
 discrete graph variables
Deleddesign: Discrete Data Definition
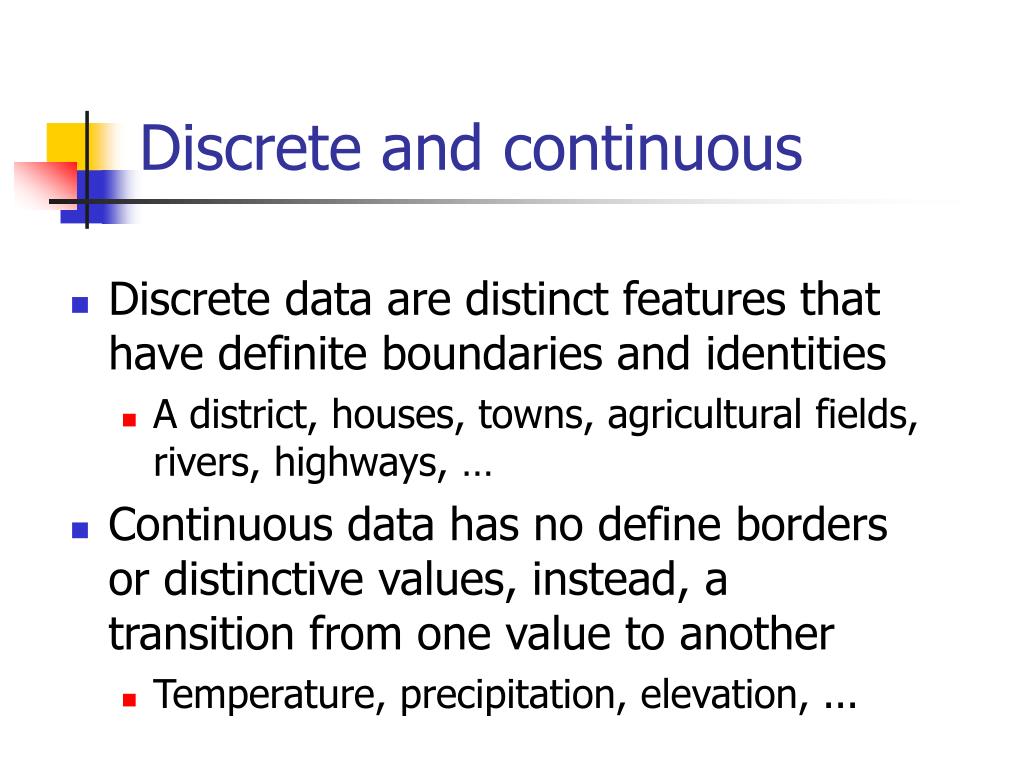 deleddesign.blogspot.com
 discrete gis
Statistics In Pharmaceutical Sciences
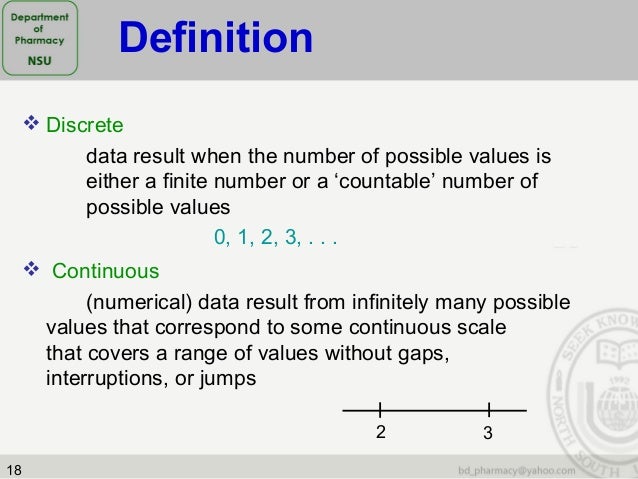 www.slideshare.net
 discrete pharmaceutical
Definition Of Discrete Data
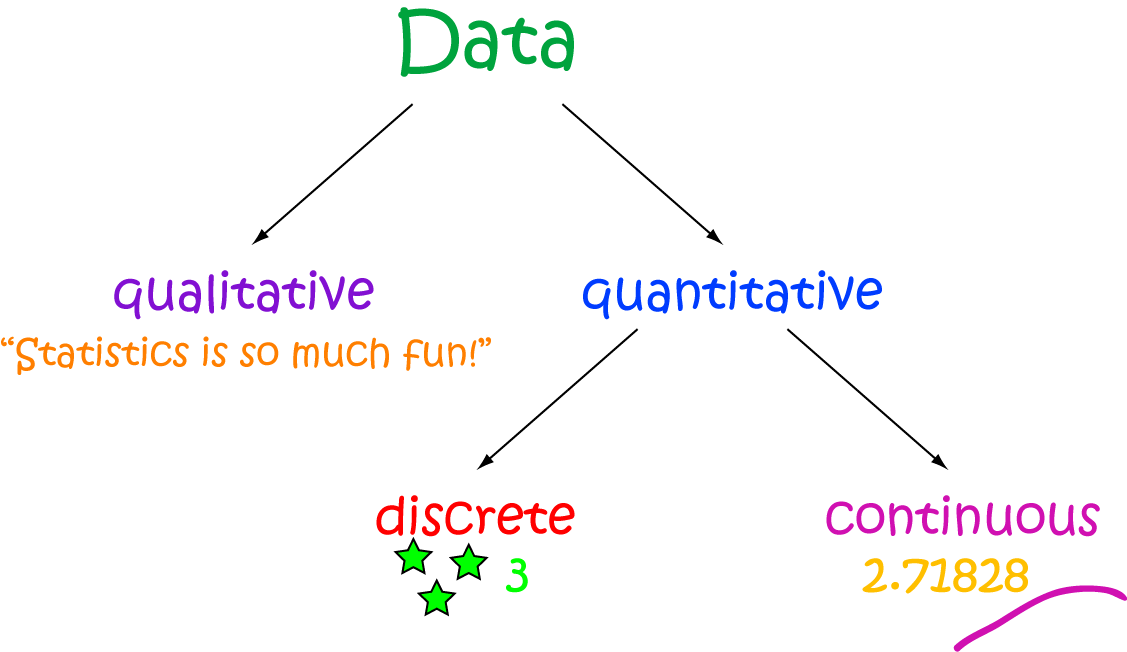
www.mathsisfun.com data math discrete statistics continuous types science qualitative quantitative examples population mathematics definition density considered why gif information systems mathsisfun
Continuous Data - Math Definitions - Letter C
 www.subjectcoach.com
 quantitative subjectcoach
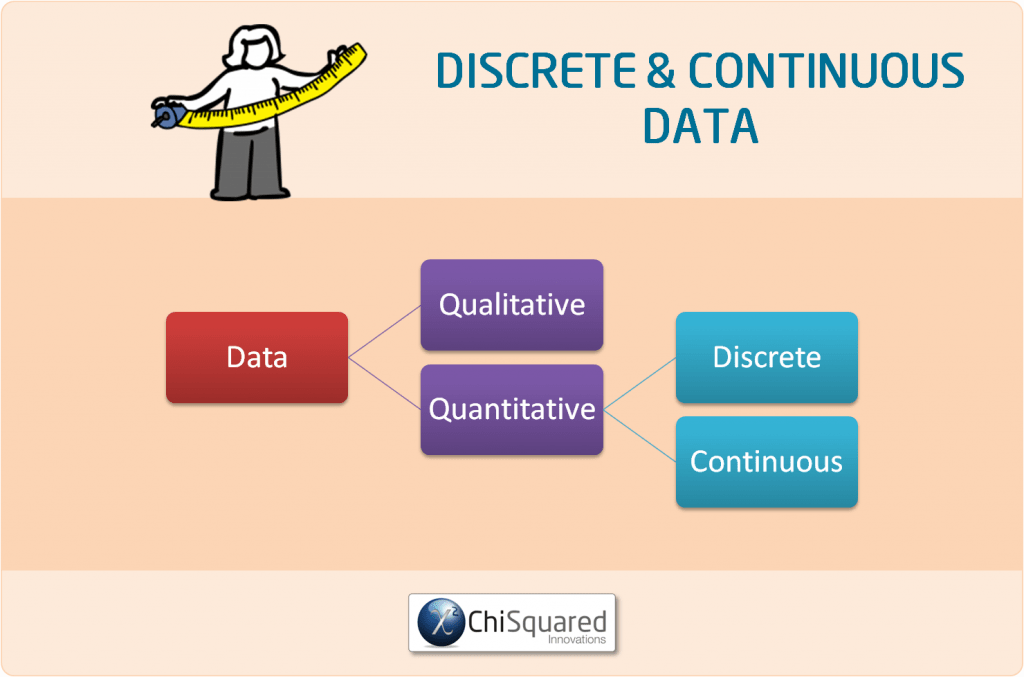
4 Types Of Data In Statistics – Definitions, Uses & Examples
www.chi2innovations.com Statistics in pharmaceutical sciences. Deleddesign: discrete data definition. Discrete gis

0 Post a Comment: