If you're someone who likes working with numbers, then understanding the difference between discrete and continuous data is crucial. These two types of data are commonly used in statistics, and though they may seem similar, they actually represent different sets of information. In this post, I'll be explaining what discrete and continuous data are and what sets them apart from each other.
Discrete Data
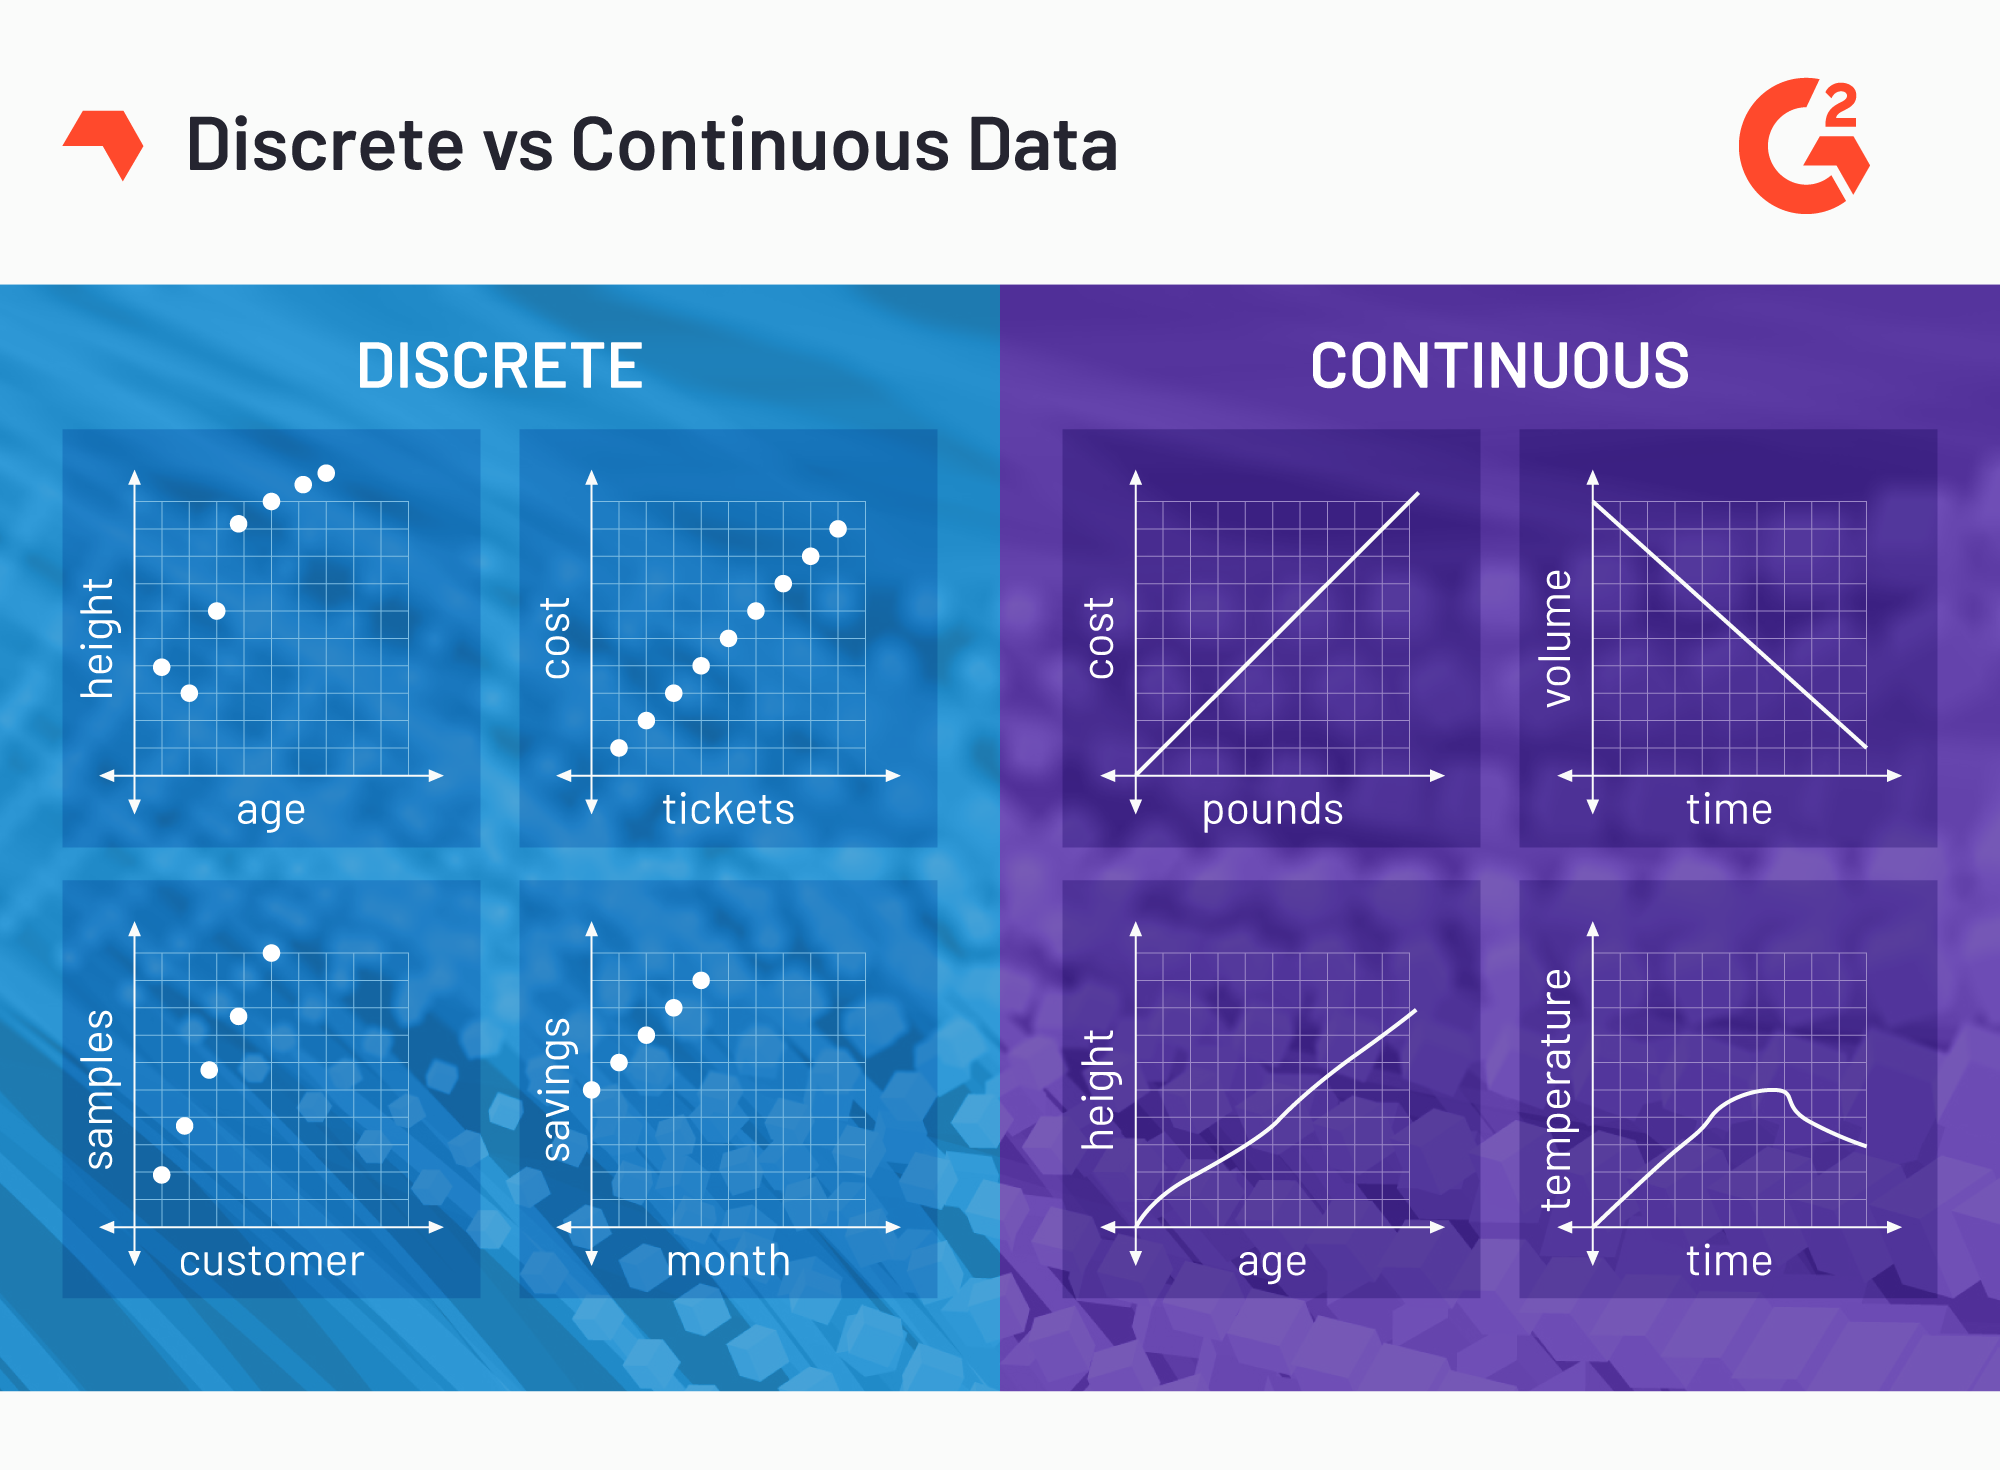
Discrete data is a type of numerical data that can only take certain values within a set range. These values are usually whole numbers and are distinct from each other. For example, the number of children in a family can only be a whole number and cannot be 2.5 or 2.7. Another example of discrete data is the number of students in a classroom, as it can only be a whole number.

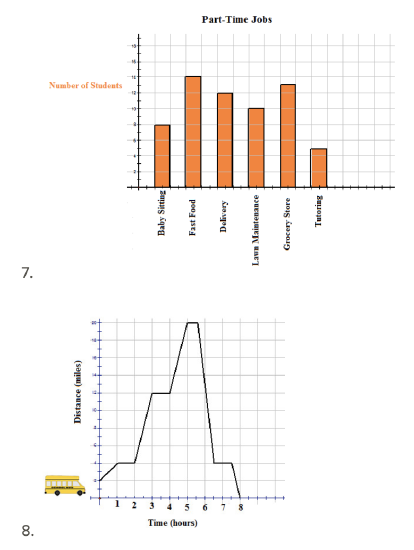
The most common way to represent discrete data is through bar graphs and histograms. In a bar graph, the x-axis would represent the different values that the data can take, while the y-axis would represent the frequency of the values. For example, if we had a set of data on the number of children in each family in a neighborhood, the x-axis would be labeled 0, 1, 2, 3, etc. and the y-axis would represent the number of families that have that many children.
Continuous Data
Continuous data, on the other hand, is a type of numerical data that can take any value within a certain range. These values are not distinct from each other and can include decimal points. For example, the height of a person is continuous data because it can be any number within a certain range (e.g. 5.3 feet, 5.4 feet, 5.5 feet, etc.). Similarly, the weight of a person is also continuous data.

The most common way to represent continuous data is through line graphs and scatterplots. In a line graph, the x-axis represents the range of values that the data can take, while the y-axis represents the frequency or density of the values. For example, if we had a set of data on the heights of people in a certain population, the x-axis would be labeled with a range of values (e.g. 5 feet to 6 feet) and the y-axis would represent the number of people within that height range.
Conclusion
In conclusion, discrete and continuous data are two types of numerical data that represent different sets of information. Discrete data can only take certain distinct values within a set range, while continuous data can take any value within a certain range. Understanding the difference between these two types of data can be crucial in fields such as statistics and data analysis.
If you are searching about Discrete Numerical Data Definition : Discrete vs Continuous Data you've came to the right place. We have 6 Pictures about Discrete Numerical Data Definition : Discrete vs Continuous Data like 1.1: Graphs for Discrete and for Continuous Data - K12 LibreTexts, Data Type and also Pin by curvature of the mind on Physics & Math yo | Pinterest. Here you go:
Discrete Numerical Data Definition : Discrete Vs Continuous Data
 kasttank.blogspot.com
 discrete numerical definition
Pin By Curvature Of The Mind On Physics & Math Yo | Pinterest
discrete data continuous numerical values math number lines line interval points innovativegis physics types if mathematics
Data Type
data types categorical numerical ordinal statistical science examples type numbers house statistics discrete quantitative different classification sets assigned number values
1.1: Graphs For Discrete And For Continuous Data - K12 LibreTexts
 k12.libretexts.org
 discrete numerical k12 libretexts quantitative qualitative categorical
Discrete Vs Continuous Data – What’s The Difference?
 www.g2.com
 discrete graph variables
Solved U Which Of The Following Statements Is Incorrect? A. | Chegg.com
 www.chegg.com
 discrete numerical incorrect following transcribed
Discrete graph variables. Discrete vs continuous data – what’s the difference?. Data types categorical numerical ordinal statistical science examples type numbers house statistics discrete quantitative different classification sets assigned number values
0 Post a Comment: